WHY’ STUDY WHAT MANY SOFTWARES OFFERS’ READY?
The study of the Foucault test results is very important in order to be able to evaluate the advice provided by the software prepared for this calculation well and independently. Nobody is perfect and even programs for these calculations are, while he is able to equally lead to the goal.
As alternatives to get to that goal can be many if not infinite, it is worthwhile to use our own properly prepared critical sense, not to blindly accept the verdict of the software.
In our reading path of the previous articles we have realized that in the creation of a parabolic mirror proceed in small steps, not being technically possible to produce the parabolization of the glass spherical surface in one fell swoop.
In previous article we have seen how the Foucault test is conducted, on the basis of which can be calculated manually by evaluations of the surface, in order to decide which to undertake remodeling in the next correction.
Let's see how a program of computer processing would have drawn the same "drawdowns" (measures) recorded with Foucault and used in the previous calculation manual.
I therefore refer to the parts of an excel sheet from me translated and adapted, which it is available in its original form to the address indicated on the same sheet.
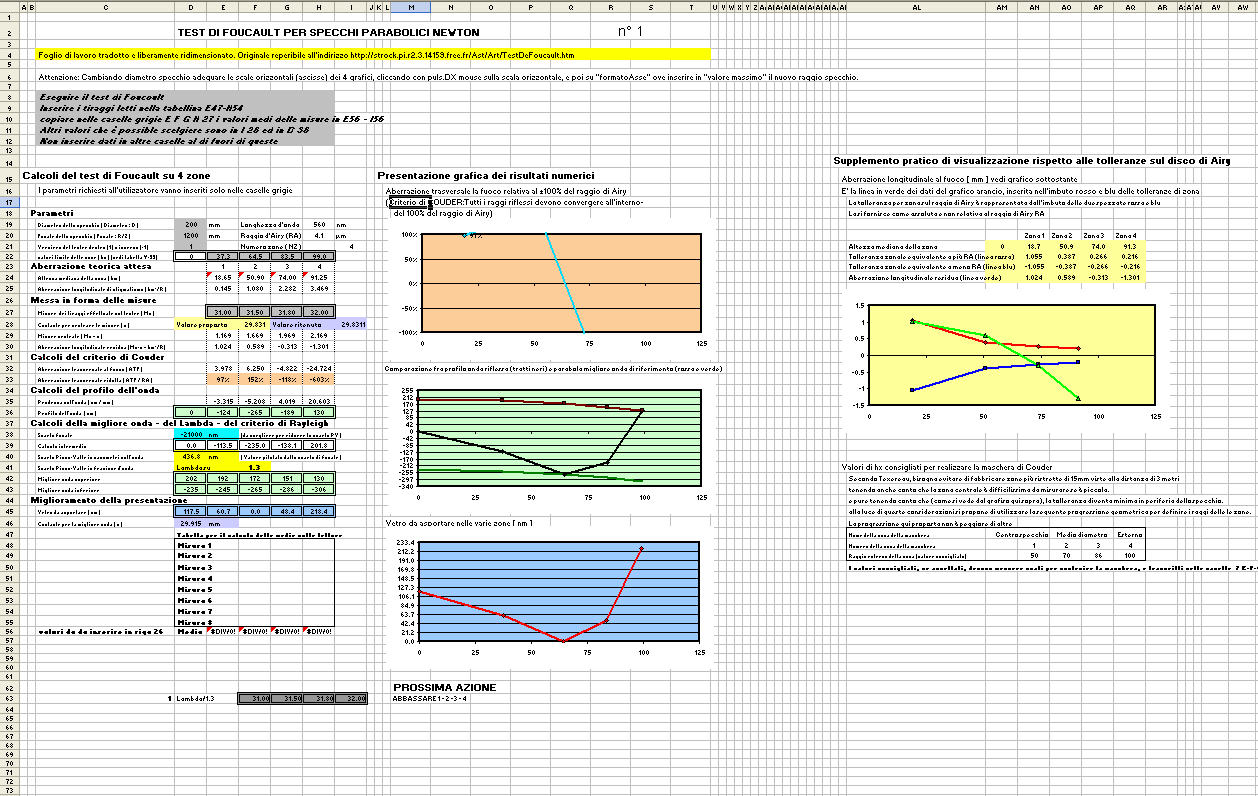
Figure 1
I use this preference sheet, to the fact that while giving me "HIS" best solution, It allows me to simulate other personal ways, and predict results. This special thing (intended as simulation possiblityes) is that other more stringent management programs do not allow testing of Foucault with the flexibility of a spreadsheet.
so let's see:
A CALCULATION OF COMPUTER FOUCAULT TEST
We find in "Figure 1 " image, that have been entered in box E,F,G,H 27, The following data refer to the four drawdowns 4 Mirror areas under examination
| 31.00 | 31.50 | 31.80 | 32.00 |
We already know that in order to verify the performance of the crude parabolic curve that we are building, We should "overlap" the perfect reference parabola putting the two curves in direct contact, and even direct comparison, at a common point, which can be any point "hm” our curve taken along the radius of the mirror.
This will allow us to see, depending on the "point of contact" chosen, what are the deviations taken from our curve compared to the reference, to determine which is the condition most favorable to a correction that takes us in the continuation of the work, to get as close as possible to the perfect parable of reference.
That practice overlapping of the two curves, is perfectly simulate with the numbers, by means of the subtraction to all measured areas, a constant appropriate (meaning distance away) which leads to the zero draft value in ONE POINT taken as mutual contact.
And just the subtraction of that same value to all areas, will perfectly simulate the movement of overlap of the two curves, the quality of which we will see an immediate result from the charts.
We remember then that the word "aberration" is a technical term that actually indicates the degree of deformation that our parable he has at that point, with respect to the sphere of origin. (or vice versa must have, if the aberration is referred to the reference parabola).
The aberration of a zone, in other words, expresses the diversity of millimeters draw that we should find in that area, so our parabola is identical to that of reference.
And remembering even more, that the curvature radius R is derivative from the focal length actually measured, which it is the basis on which the aberrations of the reference parabola are calculated: It becomes crucial that the value of the focal length is measured, checked and updated in the spreadsheet, each time it is assumed that it also can be changed very little after correction tweaks involving the center mirror.
then we calculate for each zone, the "constant" of distance that would separate the two curves, as the difference between our drawdowns (what are the real aberrations of our parable under construction) with aberrations hm2/R. own of the perfect parable of reference.
Subtracting at the values of these areas 1,2,3,4,
| 31.00 | 31.50 | 31.80 | 32.00 |
the aberrations hm2/R. of reference:
| 0.145 | 1.080 | 2.282 | 3.469 |
And we will get the following four possible constants of overlap, to try one by one:
| 30.86 | 30.42 | 29.52 | 28.53 |
So let's see what would happen to our parabolic curve under construction, overlapping in four different ways, one for each zone, the reference parable:
CONTACT ZONE 1
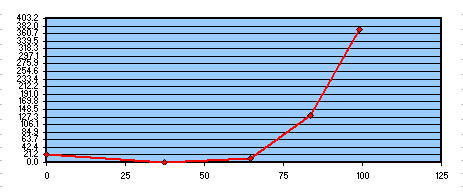
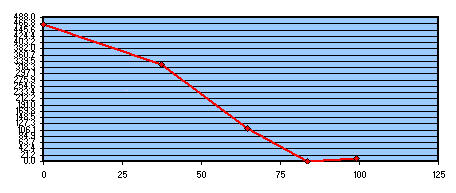
If we now try to superimpose the constant 30.86 simulating the contact area on the first zone, inserting the value 30.86 in the box i28 named "value considered". The following chart shows which fixes, and that entities, should be made to other zones 2,3 e4, to obtain the reference parabola .
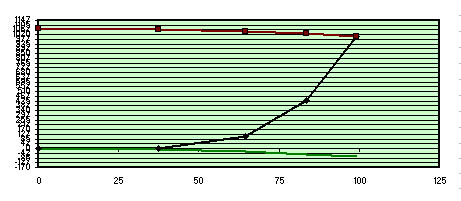
Image: Aberrations related to the area 1
Taking good for the area (zone) 1 (which in fact it can be seen perfectly superimposed on the low parable in green color, that with the upper red expresses the distance peak - the maximum valley defect in lambda / 0.5) We would find ourselves in parabolizing for the edge: that we would be in very unfavorable conditions, to have an extremely raised edge with the need to remove almost 500 nanometers of glass (look at blue graph) in zone 4 e 3, which would mean too much work.
Glass nanometers to be removed to get the parable of the good reference holding area 1
CONTACT ZONE 2:
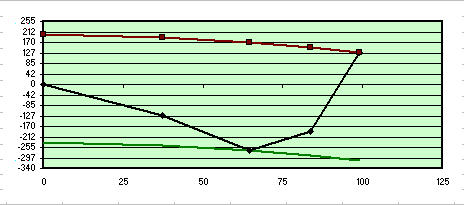
Let's try now superimpose in area 2, using the constant 30.42 box in i28. The following chart shows which fixes, and that entities, should be made to other zones 1, 3 e 4 to obtain the reference parabola .
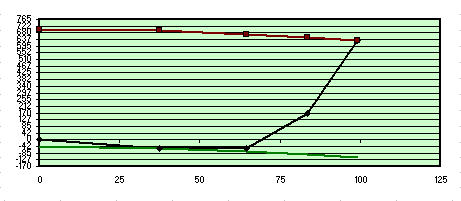
Image: Aberrations related to the area 2
Taking good for the area (zone) 2 (which in fact it can be seen perfectly superimposed on the low parable in green color, that with the upper red expresses the distance peak - the maximum defect valley contained in lambda / 0.8) we would still parabolizing for the edge, then under unfavorable conditions even a little better from the previous, because we have the area 1 of 21,2 nanometers slightly higher perfection; but we would still have to have the areas 3 e 4 very high, with a quantity of glass to be removed approximately 362 nanometers in total area 4 e 3. That would mean too much work.
Glass nanometers to be removed to get the parable of the good reference holding area 2
CONTACT ZONE 3:
Let's try now superimpose in area 3, using the constant 29.52 box in i28
The following chart shows which fixes, and that entities, should be made to other zones 1, 2 e 4 to obtain the reference parabola .
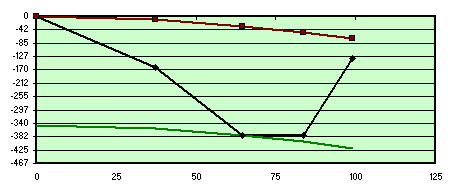
Image: Aberrations related to the area 3
Taking good for the area (zone) 3 (which in fact it can be seen superimposed on the low parable in green color, that with the upper red expresses the distance peak - the maximum valley defect in lambda / 1.6) we would be parabolizing for 70% the diameter; we would be in good condition, in what we have zones 1 e 2 e 4 "High" total, but easy to "lower" . when no risk, with special attention to the area 4 to avoid working it too much and badly, to get from a nice edge high, a bad Turned Down Edge impossible to correct without going back a little bit to the sphere.
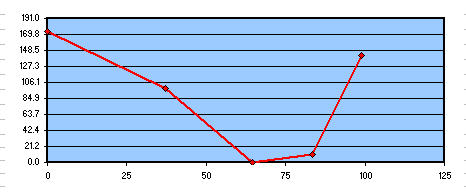
Glass nanometers to be removed to get the parable of the good reference holding area 3
CONTACT ZONE 4:
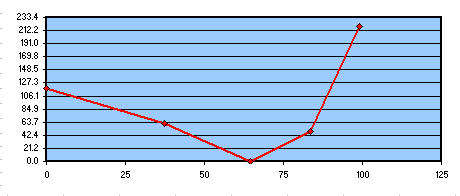
Let's try now superimpose in area 4, using the constant 28.53 box in i28
The following chart shows which fixes, and that entities, should be made to other zones 1, 2 e 3 to obtain the reference parabola .
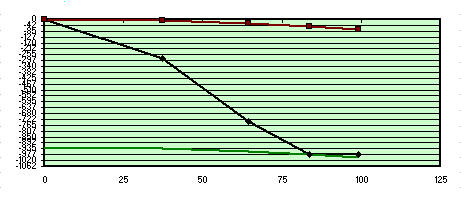
Image: Aberrations related to the area 4
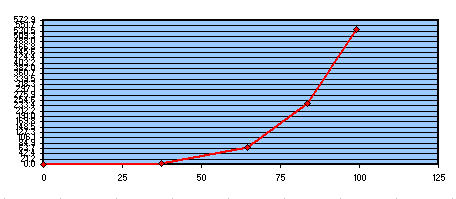
Taking good for the area (zone) 4 (which in fact it can be seen superimposed on the low parable in green color, that with the upper red expresses the distance peak - the maximum valley defect in lambda / 0.6) we would be parabolizing to the center mirror, that is, we would find ourselves having to choose between two interesting cases:
- the “bad” condition of the central area of the mirror, given by the fact that we would have the zones 1,2 e 3, to dig well 462 nanometers high., which, it would not be convenient in light of the longer working time we would have to do, albeit with large machining tolerances .
- the “Great” condition of that area 4 at mirror edge already perfect, where there are very tight machining tolerances. Excellent and tempting because, that long work of lowering the zones 1,2,3 centers, away from the mirror edge, and with a very wide machining tolerance, it would take place away from the mirror edge and with absolutely no risk of a Turned Down Edge.
Glass nanometers to be removed to get the parable of the good reference holding area 4
These four different overlays, are an example of the variability of the work required bringing as a reference several possibles points, that for simplicity and without hegsotic calculations, we have tryed and considered the center of our four zones.
CONTACT POINT IN THE SUGGESTED BY THE SOFTWARE SHOWN 1:
Despite our variations, the formulas contained in the sheet product will automatically have a variable 29.831mm, the result from the sum of our four measures, to which was subtracted the sum of the four aberrations reference, mediating finally by dividing this result by 4 , just how many zones we have, with the following graphic result:
Aberrations relating to the area calculated from the sheet
Taking as good the constant software calculated 29.83, that "geometrically" indicates a point between the zone 2 and 3, (that in fact you see that point superimposed on the low parable in green color, that with the red upper expresses the distance peak - the maximum valley defect in lambda / 1.3) we would be around for parabolizing from 70% diameter, that means, we would be in good condition, although one 0.3 worse than those of our simulation on the our yet experimented contact area 3. But at this point of the processing ,substantially equivalent to those of our simulation on the contact zone 3, in what we have zones 1 e 2 "High" total, but easy to "lower" , and a zone 4 higher than our simulation, and at the time without big risk.
Glass nanometrs to be removed to obtain the parabola reference taking good the contact point suggested from the sheet
WHAT THIS LITTLE SHOW MAY DEMONSTRATE YOU?
The apparent futility of this academic argument serves to familiarize yourself with the endless ways that lead to a perfect mirror parabolization, the result of which depends only on the perseverance of those who work, and from having realized that behind the rigid and comfortable results provided by the software prepared for the Foucault test, and not taking or suffering uncritically such results..
Simulating manually it can happen that you find a way “still better than the best”, to achieve a good result in unthinkable without simulation conditions.
the simulation is powerful and should not be relegated only to the possibilities given by the zones mentioned in this article, but can be very useful especially to try to change draft values (espected as measurables by Foucault tester) in one or more zones, coherently at the hoping results for the next action of correction that we have already decided to undertake, to judge for ourselves if that would happen is good, and what many good it is.
It happens that practicing simulations, one realizes that with a light action might get a surprising double-digit lambda quality of the mirror, otherwise unimaginable.